

How To Debug Safari On Iphone
Before iOS 6, the iPhone's Safari web browser had a built-in Debug Console that developers used to track down web page defects. If you have an iPhone running an early version of iOS, you can access the Debug Console through Settings > Safari > Developer > Debug Console. Whenever Safari on the iPhone detects CSS, HTML, and JavaScript errors, details of each are displayed in the debugger
All the recent versions of iOS use Web Inspector instead. You can activate this in the Safari settings on the iPhone or another iOS device. To use Web Inspector, you connect the iPhone to your Mac computer with a cable and open the Mac's Safari, where you enable the Develop menu in Safari's Advanced Preferences. Web Inspector is only compatible with Mac computers
Note: Information in this article applies to iPhones and other iOS devices running iOS 6 through iOS 12 and Macs on Mac OS X 10.5 Leopard and later unless otherwise noted Activate Web Inspector on iPhone iOS 6 and Later
The Web Inspector is disabled by default since most iPhone users have no use for it. However, developers can activate it in just a few short steps. Here's how:
1. Tap the Settings icon on the iPhone Home screen

2. Scroll down until you reach Safari and tap on it to open the screen that contains
everything related to the Safari web browser on your iPhone, iPad, or iPod touch

3. Scroll to the bottom of the screen and tap Advanced menu

4. Toggle the slider next to Web Inspector to the On position

Connect iPhone to Safari on a Mac
To use the Web Inspector, connect your iPhone or another iOS device to a Mac that's running the Safari web browser. Plug your device into the computer using a cable
With Safari open, do the following:
1. Click Safari in the menu bar and choose Preferences

2. Click the Advanced tab in the Preferences
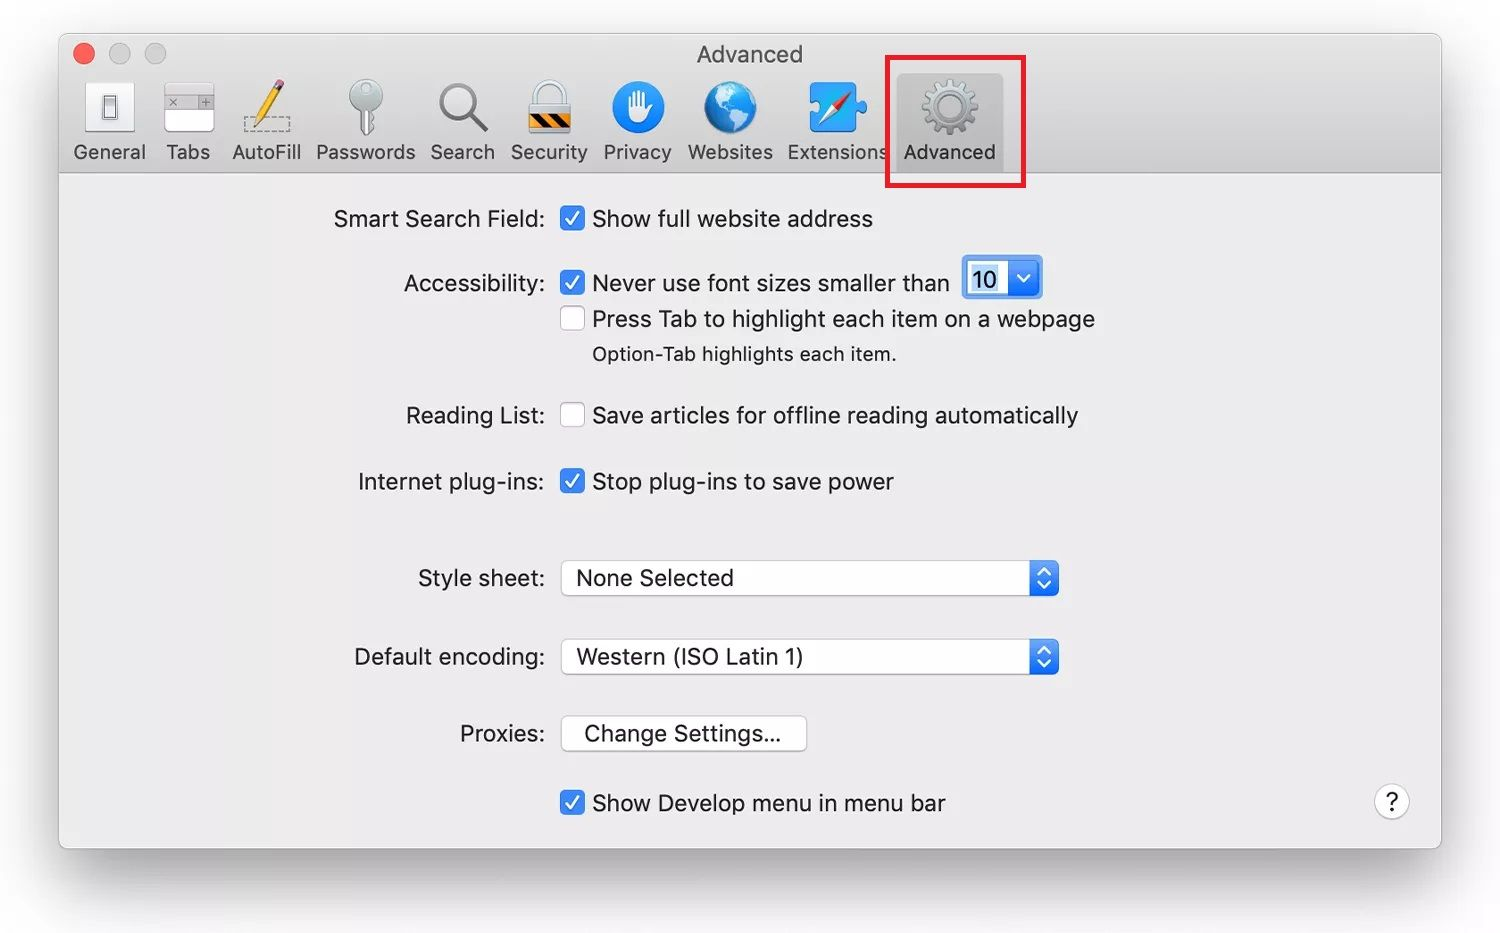
3. Select the box next to Show Develop menu in menu bar

4. Exit the settings window
5. Click Develop in the Safari menu bar and click Show/Connect Web Inspector

Your attached iPhone or other iOS device appears in the Develop drop-down menu. With Web Inspector open, developers can inspect all the resources on a web page. The Web Inspector window contains editable HTML and notes regarding the styles and layers of the web page in a separate panel. With Safari 9 and OS X 10.9 Mavericks, Apple introduced Responsive Design Mode in Web Inspector. Developers use this built-in simulator to preview how web pages scale to different screen sizes, resolutions, and orientations.
How To Debug Safari On Iphone
Source: https://help.remo.co/en/support/solutions/articles/63000251570-how-to-activate-the-iphone-debug-console-or-web-inspector-
Posted by: leefolong.blogspot.com
0 Response to "How To Debug Safari On Iphone"
Post a Comment